Saturday, July 23, 2022

Module 3: Visibility Analysis

This week we were tasked to complete 4 Esri courses through ArcGIS Online. By passing the quizzes at the end of the courses the certificate was awarded. These exercises were intended to give us more knowledge on visibility analysis. The first course was Introduction to 3D Visualization and I learned navigate 3D scenes, manipulate height variables in a data visualization, how to convert a 2D map in to a 3D local scene, applying 3D symbology and applying realistic enhancements to local and global scenes. The second course was Performing Line of Sight Analysis where I used tools Construct Sight Lines, Line of Sight, and Add Z Information to see parade routes through a city to determine the lines of sight for observers and visibility between observer points and the parade route. The third course was Performing Viewshed Analysis, where I modeled new lighting in a campground. Tools to accomplish this were Viewshed, and we modified field values, and modeled the light coverage until the light coverage was improved. The fourth and last course was Sharing 3D Content from data in the city of Portland, Oregon. To accomplish this we displayed the 2D data as 3D layers, and converted the 2D data to 3D data using the Layer 3D to Feature Class and Feature to 3D By Attribute tools.

As you can see numerous tools were implemented and I learned a great deal from the Esri courses. They have so much information packed into not only the online portion, but the directions for the exercises are full of tips and tricks that I will use in the future. For instance, many items were manipulated in just the properties of the item. Tools were used here and there to accomplish tasks, however it was interesting to see more ways data can be changed using only the properties dialog box. Another trick I learned was in the symbology of 3D items and how to configure the properties to better reflect the environment, including sunlight shadows and the ways water can move.

Here are my resulting certificates to make this post more appealing to the eye.

Sunday, July 17, 2022

Module 2: Forestry and LiDAR

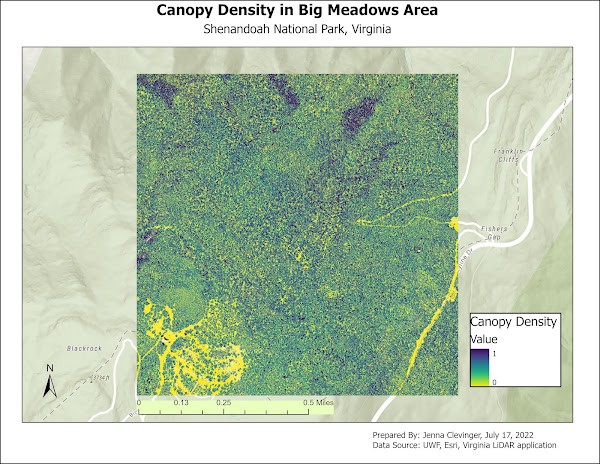
This week we were given a .las LiDAR file with data from the Big Meadows area of the Shenandoah National Park in Virginia. We learned how to decompress .las files, create DEMs from LiDAR, create DSMs from Lidar, and calculating forest height from LiDAR. Tools used were LAS Dataset to Raster, Minus, LAS to Multipoint, Point to Raster, IS NULL, Con, Plus, Float, and Divide. From there, the data gained was used to display 3 maps as seen below.

The first map shows tree heights with a distribution bar graph below it.

The second map is of canopy density.

The third map is a LiDAR elevation map with a LiDAR_Derived DEM below it.

Comments: This week ran smooth with almost no issues that I could tell and becoming more aquainted with everything ArcGIS can do is a plus that will only help me in the future.

Sunday, July 10, 2022

Module 1: Crime Analysis

For this lab the task was to show hotspot analysis using 3 methods (Grid-Based Thematic Mapping, Kernel Density, and Local Moran's I) The below screenshots show the hotspots of homicides from 2017 in Chicago, IL.

First up is Grid-Based: Based on a grid of 1/2 mile cells clipped to the Chicago city boundary, the end result is the grids with the top 20% overall highest count of homicides. Utilizing Spatial Join, Select by Attributes, and Dissolve tools.

Second is Kernel Density: This map shows the density of homicides that are three times the mean of the data. Utilizing Kernel Density, Reclassify, and Select by Attributes tools.

Last is Local Moran's I: This map uses crime counts and number of homicides per 1,000 housing units for each census block group. The result is spatial clusters of the high-high clusters that are in close proximity to other areas with a high homicide rate. Utilizing Spatial Join, Cluster and Outlier Analysis, and SQL Query tools.

Comments: Other than input and output data any remaining parameters in the tools used were left as default per lab instructions.

Saturday, July 2, 2022

About Me

My name is Jenna Clevinger, and I joined the UWF GIS Certificate Program in hopes of combining my BA in Anthropology with GIS for an exciting new career. I gained an interest for maps while I was enlisted in the U.S. Navy for 8 years as a Quartermaster. During my time I learned all about navigation and was able to have some interesting land and underwater archaeology volunteer opportunities in my travels. I hope to gain enough knowledge from the program to get my foot in the door of a surveying or related GIS career. I have drive, passion and willingness to learn. Having a GIS related career my goal, but you never know where life will take you, so I am open to exploration along the way. My Story Map is here.

GIS Portfolio

The final assignment in the GIS Certificate Program was to create a GIS Portfolio. It went as I expected. It is hard to write about yourself...